Every year, you help fund academic research across every discipline — from cancer research, space exploration, and climate modeling,
to education, equity, and public policy.
Funnel Visualization Second Funnel Visualization Third Funnel Visualization
Federal agencies like NIH, NSF, NASA, and NEH distribute research funding to universities and institutes, where scholars carry out the work.
Peer review, a critical part of the publishing process, relies almost entirely on researchers volunteering their time.
Sometimes the resulting publications are locked behind paywalls, forcing institutions (or the public) to pay again just to access them.

Othertimes, researchers pay thousands upfront to publish in open-access journals.
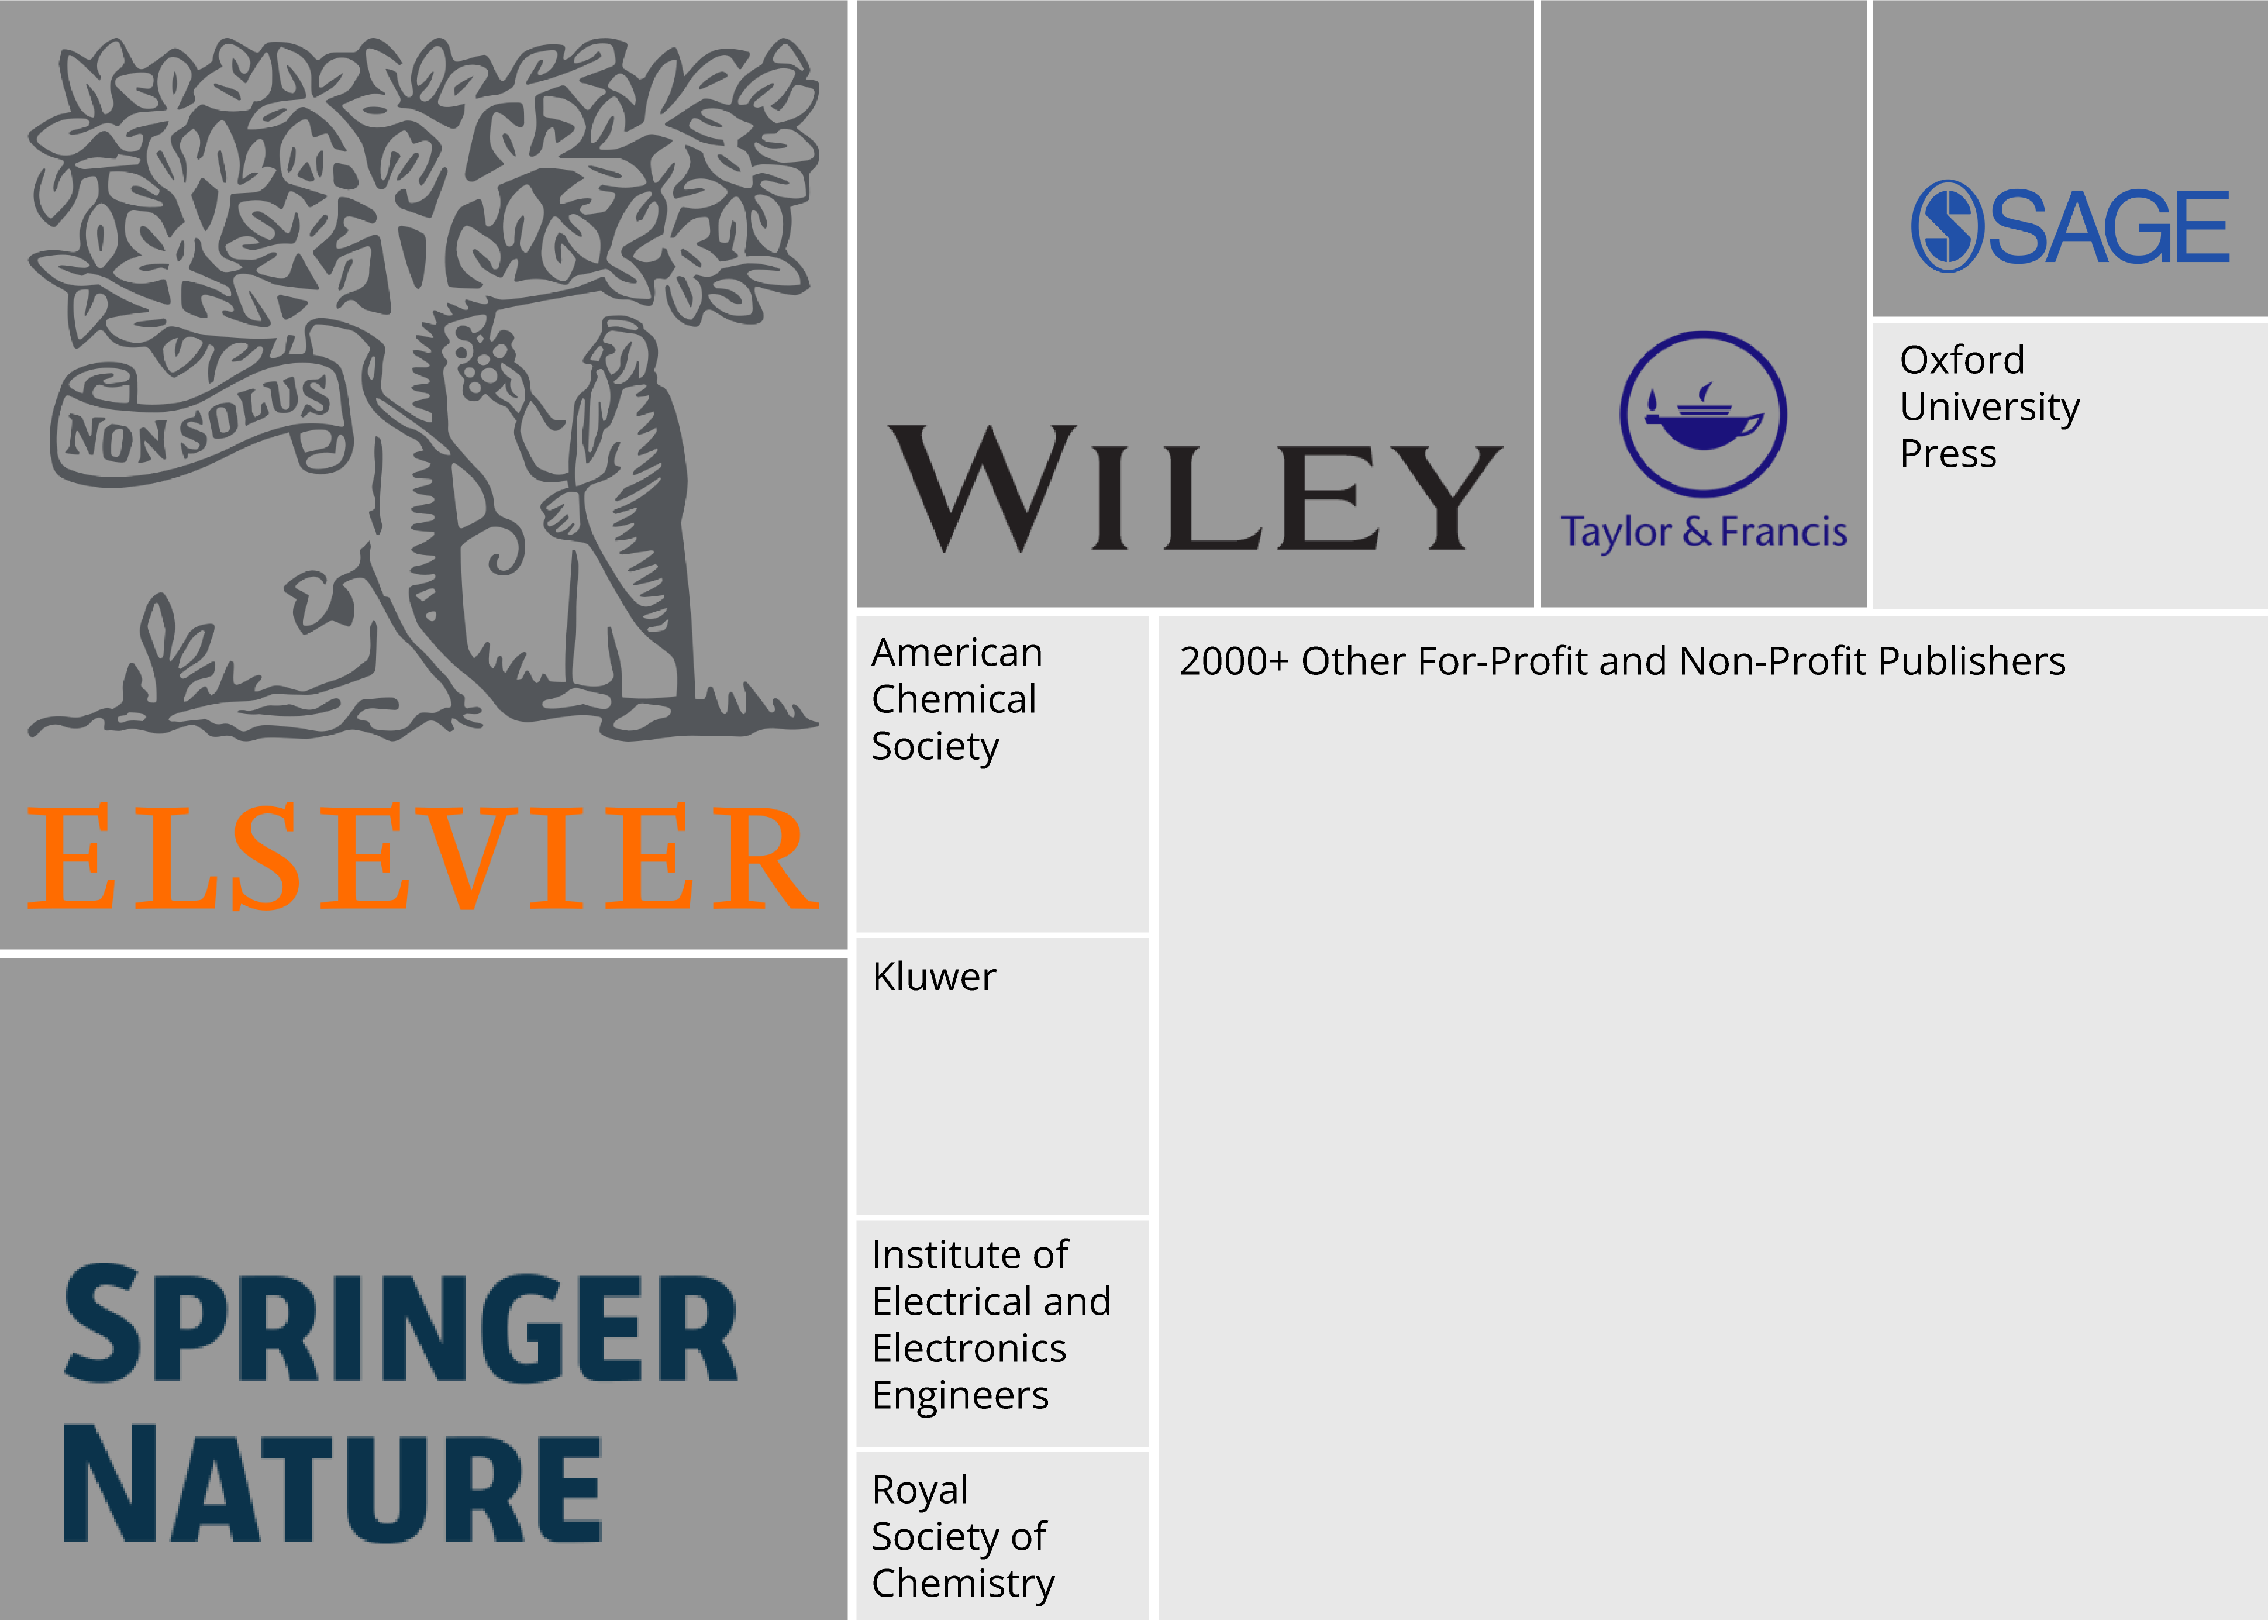
Either way, commercial publishers profit.


A handful of private publishing companies control most of academic publishing, making billions off a system built on publicly funded research and unpaid academic labor.

Just five companies collectively account for around 50% of global research output. This treemap visualizes their dominance in academic publishing.
Treemap of Publisher Share
The top three publishers account for more than half of global academic publishing revenue:
~$5.2B of $9.9B total.
Elsevier, the biggest player in this business, has profit margins of nearly 40%.
That’s higher than Apple 32%, higher than Pfizer 13%, and even LVMH 22%.
Coinography of Publishing Profits

Mass editorial resignations from academic journals are accelerating

This chart shows the number of journals per year where multiple editors resigned together, often in protest of high publishing fees, loss of editorial independence, and profit-driven policies.
When academic publishing rewards speed, volume, and prestige above all else, it encourages a culture where corners are cut, methods are rushed, and findings are less reliable. The for-profit system thrives on publish-or-perish pressure, fueling low-quality research and deepening the reproducibility crisis. To serve the public good, we need a system that rewards integrity over output.

About the Data

Treemap Chart
Source: Kim & Park (2020), Influence of the top 10 journal publishers listed in Journal Citation Reports based on six indicators. Calculated from Journal Citation Reports 2014 to 2018. doi:/10.6087/kcse.209.

Market Share
Source: Kim & Park (2020), Market share of the largest publishers in Journal Citation Reports based on journal price and article processing charge. Prices collected from February to April 2020. doi:/10.6087/kcse.210.

Editorial Walkouts
Retraction Watch Resignation List.
Open Access Directory: Journal Declarations of Independence.